Full example
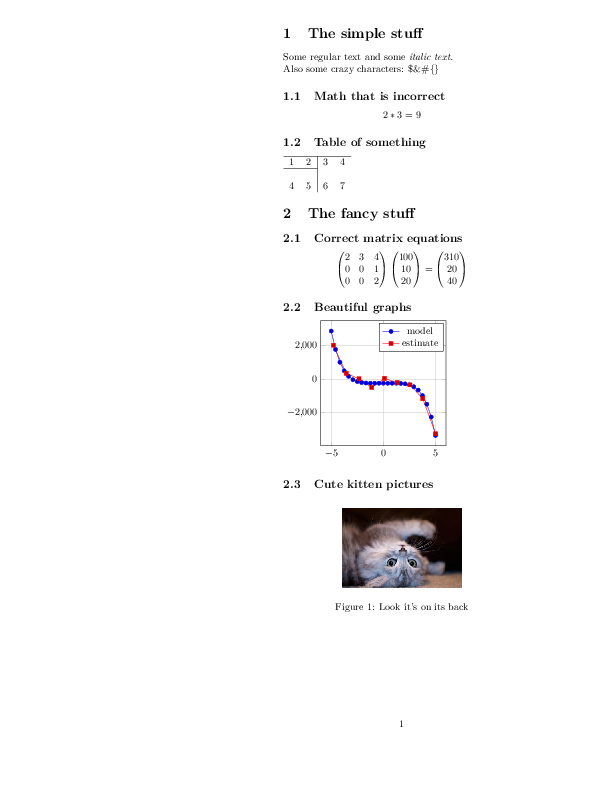
This example shows matplotlib functionality.
The code
import numpy as np

from pylatex import Document, Section, Subsection, Tabular, Math, TikZ, Axis, \
    Plot, Figure, Package, Matrix
from pylatex.utils import italic
import os

if __name__ == '__main__':
    image_filename = os.path.join(os.path.dirname(__file__), 'kitten.jpg')

    doc = Document()
    doc.packages.append(Package('geometry', options=['tmargin=1cm',
                                                     'lmargin=10cm']))

    with doc.create(Section('The simple stuff')):
        doc.append('Some regular text and some')
        doc.append(italic('italic text. '))
        doc.append('\nAlso some crazy characters: $&#{}')
        with doc.create(Subsection('Math that is incorrect')):
            doc.append(Math(data=['2*3', '=', 9]))

        with doc.create(Subsection('Table of something')):
            with doc.create(Tabular('rc|cl')) as table:
                table.add_hline()
                table.add_row((1, 2, 3, 4))
                table.add_hline(1, 2)
                table.add_empty_row()
                table.add_row((4, 5, 6, 7))

    a = np.array([[100, 10, 20]]).T
    M = np.matrix([[2, 3, 4],
                   [0, 0, 1],
                   [0, 0, 2]])

    with doc.create(Section('The fancy stuff')):
        with doc.create(Subsection('Correct matrix equations')):
            doc.append(Math(data=[Matrix(M), Matrix(a), '=', Matrix(M * a)]))

        with doc.create(Subsection('Beautiful graphs')):
            with doc.create(TikZ()):
                plot_options = 'height=6cm, width=6cm, grid=major'
                with doc.create(Axis(options=plot_options)) as plot:
                    plot.append(Plot(name='model', func='-x^5 - 242'))

                    coordinates = [
                        (-4.77778, 2027.60977),
                        (-3.55556, 347.84069),
                        (-2.33333, 22.58953),
                        (-1.11111, -493.50066),
                        (0.11111, 46.66082),
                        (1.33333, -205.56286),
                        (2.55556, -341.40638),
                        (3.77778, -1169.24780),
                        (5.00000, -3269.56775),
                    ]

                    plot.append(Plot(name='estimate', coordinates=coordinates))

        with doc.create(Subsection('Cute kitten pictures')):
            with doc.create(Figure(position='h!')) as kitten_pic:
                kitten_pic.add_image(image_filename, width='120px')
                kitten_pic.add_caption('Look it\'s on its back')

    doc.generate_pdf('full')
The generated pdfs
full.pdf