Full example
This example demonstrates several features of PyLaTeX.
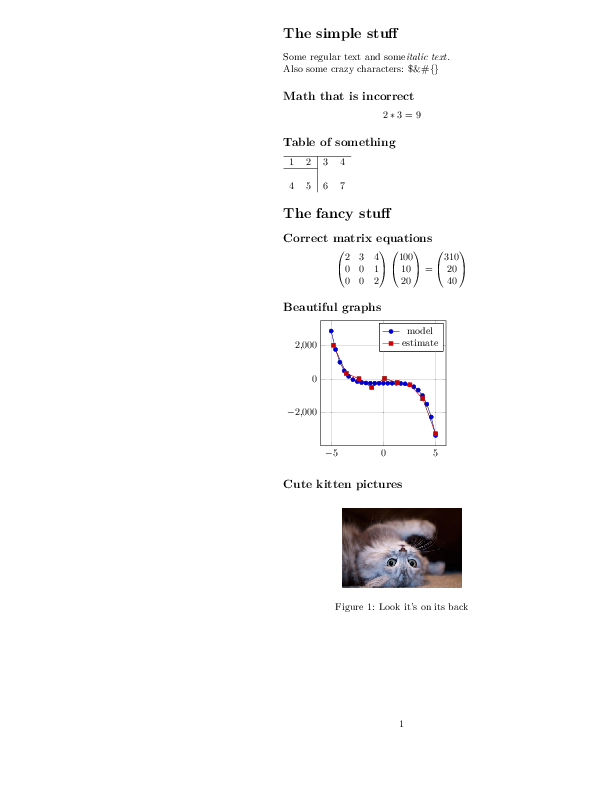
It includes plain equations, tables, equations using numpy objects, tikz plots, and figures.
The code
import numpy as np

from pylatex import Document, Section, Subsection, Tabular, Math, TikZ, Axis, \
    Plot, Figure, Matrix
from pylatex.utils import italic
import os

if __name__ == '__main__':
    image_filename = os.path.join(os.path.dirname(__file__), 'kitten.jpg')

    geometry_options = {"tmargin": "1cm", "lmargin": "10cm"}
    doc = Document(geometry_options=geometry_options)

    with doc.create(Section('The simple stuff')):
        doc.append('Some regular text and some')
        doc.append(italic('italic text. '))
        doc.append('\nAlso some crazy characters: $&#{}')
        with doc.create(Subsection('Math that is incorrect')):
            doc.append(Math(data=['2*3', '=', 9]))

        with doc.create(Subsection('Table of something')):
            with doc.create(Tabular('rc|cl')) as table:
                table.add_hline()
                table.add_row((1, 2, 3, 4))
                table.add_hline(1, 2)
                table.add_empty_row()
                table.add_row((4, 5, 6, 7))

    a = np.array([[100, 10, 20]]).T
    M = np.matrix([[2, 3, 4],
                   [0, 0, 1],
                   [0, 0, 2]])

    with doc.create(Section('The fancy stuff')):
        with doc.create(Subsection('Correct matrix equations')):
            doc.append(Math(data=[Matrix(M), Matrix(a), '=', Matrix(M * a)]))

        with doc.create(Subsection('Beautiful graphs')):
            with doc.create(TikZ()):
                plot_options = 'height=6cm, width=6cm, grid=major'
                with doc.create(Axis(options=plot_options)) as plot:
                    plot.append(Plot(name='model', func='-x^5 - 242'))

                    coordinates = [
                        (-4.77778, 2027.60977),
                        (-3.55556, 347.84069),
                        (-2.33333, 22.58953),
                        (-1.11111, -493.50066),
                        (0.11111, 46.66082),
                        (1.33333, -205.56286),
                        (2.55556, -341.40638),
                        (3.77778, -1169.24780),
                        (5.00000, -3269.56775),
                    ]

                    plot.append(Plot(name='estimate', coordinates=coordinates))

        with doc.create(Subsection('Cute kitten pictures')):
            with doc.create(Figure(position='h!')) as kitten_pic:
                kitten_pic.add_image(image_filename, width='120px')
                kitten_pic.add_caption('Look it\'s on its back')

    doc.generate_pdf('full', clean_tex=False)
The generated files
full.tex
1 2 3 4 5 6 7 8 9 10 11 12 13 14 15 16 17 18 19 20 21 22 23 24 25 26 27 28 29 30 31 32 33 34 35 36 37 38 39 40 41 42 43 44 45 46 47 48 49 50 51 52 53 54 55 56 57 58 59 60 61 62 63 64 65 66 67 68 69 70 71 72 73 74 75 76 77 78 79 80 81 82 83 84 85 86 87 88 89 90 91 92 93 | \documentclass{article}%
\usepackage[T1]{fontenc}%
\usepackage[utf8]{inputenc}%
\usepackage{lmodern}%
\usepackage{textcomp}%
\usepackage{lastpage}%
\usepackage[tmargin=1cm,lmargin=10cm]{geometry}%
\usepackage{amsmath}%
\usepackage{tikz}%
\usepackage{pgfplots}%
\pgfplotsset{compat=newest}%
\usepackage{graphicx}%
%
%
%
\begin{document}%
\normalsize%
\section*{The simple stuff}%
Some regular text and some%
\textit{italic text. }%
\newline%
Also some crazy characters: \$\&\#\{\}%
\subsection*{Math that is incorrect}%
\[%
2*3 = 9%
\]
%
\subsection*{Table of something}%
\begin{tabular}{rc|cl}%
\hline%
1&2&3&4\\%
\cline{1%
-%
2}%
&&&\\%
4&5&6&7\\%
\end{tabular}
%
\section*{The fancy stuff}%
\subsection*{Correct matrix equations}%
\[%
\begin{pmatrix}%
2&3&4\\%
0&0&1\\%
0&0&2%
\end{pmatrix} \begin{pmatrix}%
100\\%
10\\%
20%
\end{pmatrix} = \begin{pmatrix}%
310\\%
20\\%
40%
\end{pmatrix}%
\]
%
\subsection*{Beautiful graphs}%
\begin{tikzpicture}%
\begin{axis}[height=6cm, width=6cm, grid=major]%
\addplot{-x^5 - 242};%
%
\addlegendentry{model}%
\addplot coordinates {%
(-4.77778,2027.60977)%
(-3.55556,347.84069)%
(-2.33333,22.58953)%
(-1.11111,-493.50066)%
(0.11111,46.66082)%
(1.33333,-205.56286)%
(2.55556,-341.40638)%
(3.77778,-1169.2478)%
(5.0,-3269.56775)%
};%
%
\addlegendentry{estimate}%
\end{axis}%
\end{tikzpicture}
%
\subsection*{Cute kitten pictures}%
\begin{figure}[h!]%
\centering%
\includegraphics[width=120px]{../../../../examples/kitten.jpg}%
\caption{Look it's on its back}%
\end{figure}
%
\end{document}
|
full.pdf