Matplotlib example
This example shows matplotlib functionality.
The code
import matplotlib
from pylatex import Document, Figure, NoEscape, Section
matplotlib.use("Agg") # Not to use X server. For TravisCI.
import matplotlib.pyplot as plt # noqa
def main(fname, width, *args, **kwargs):
geometry_options = {"right": "2cm", "left": "2cm"}
doc = Document(fname, geometry_options=geometry_options)
doc.append("Introduction.")
with doc.create(Section("I am a section")):
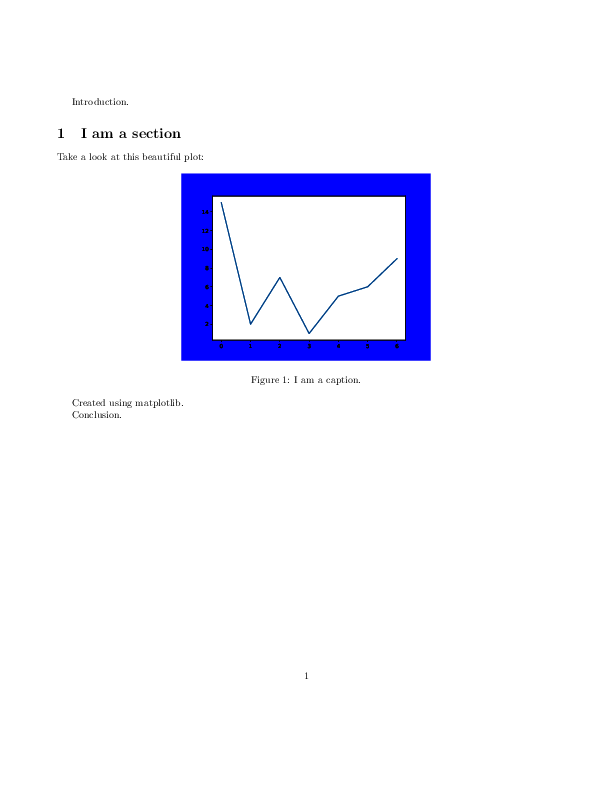
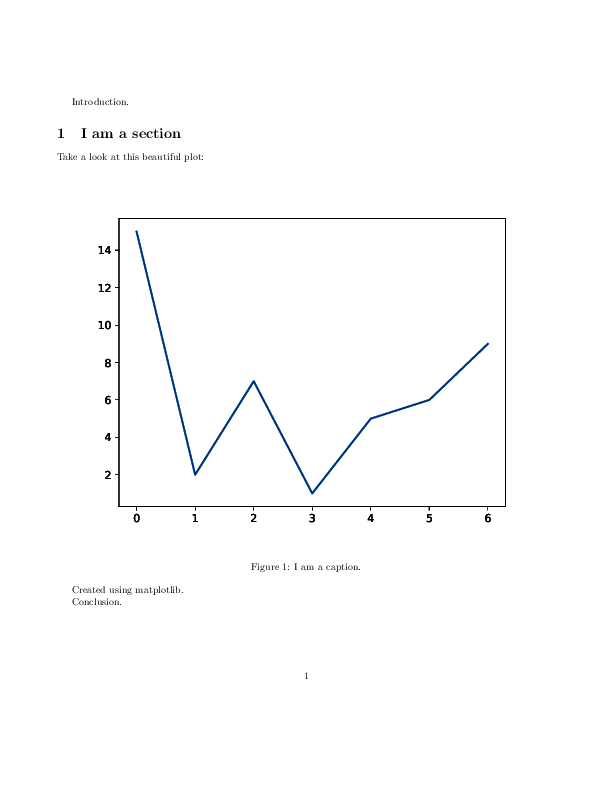
doc.append("Take a look at this beautiful plot:")
with doc.create(Figure(position="htbp")) as plot:
plot.add_plot(width=NoEscape(width), *args, **kwargs)
plot.add_caption("I am a caption.")
doc.append("Created using matplotlib.")
doc.append("Conclusion.")
doc.generate_pdf(clean_tex=False)
if __name__ == "__main__":
x = [0, 1, 2, 3, 4, 5, 6]
y = [15, 2, 7, 1, 5, 6, 9]
plt.plot(x, y)
main("matplotlib_ex-dpi", r"1\textwidth", dpi=300)
main("matplotlib_ex-facecolor", r"0.5\textwidth", facecolor="b")
The generated files
matplotlib_ex-dpi.tex
1 2 3 4 5 6 7 8 9 10 11 12 13 14 15 16 17 18 19 20 21 22 23 24 25 26 27 28 29 30 31 32 | \documentclass{article}% \usepackage[T1]{fontenc}% \usepackage[utf8]{inputenc}% \usepackage{lmodern}% \usepackage{textcomp}% \usepackage{lastpage}% \usepackage{geometry}% \geometry{right=2cm,left=2cm}% \usepackage{graphicx}% % % % \begin{document}% \normalsize% Introduction.% \section{I am a section}% \label{sec:Iamasection}% Take a look at this beautiful plot:% \begin{figure}[htbp]% \centering% \includegraphics[width=1\textwidth]{/tmp/pylatex-tmp.2s07hy4n/b334f481-bffd-4f1c-ac4f-27b016a89a66.pdf}% \caption{I am a caption.}% \end{figure} % Created using matplotlib. % Conclusion.% \end{document} |
matplotlib_ex-dpi.pdf
matplotlib_ex-facecolor.tex
1 2 3 4 5 6 7 8 9 10 11 12 13 14 15 16 17 18 19 20 21 22 23 24 25 26 27 28 29 30 31 32 | \documentclass{article}% \usepackage[T1]{fontenc}% \usepackage[utf8]{inputenc}% \usepackage{lmodern}% \usepackage{textcomp}% \usepackage{lastpage}% \usepackage{geometry}% \geometry{right=2cm,left=2cm}% \usepackage{graphicx}% % % % \begin{document}% \normalsize% Introduction.% \section{I am a section}% \label{sec:Iamasection}% Take a look at this beautiful plot:% \begin{figure}[htbp]% \centering% \includegraphics[width=0.5\textwidth]{/tmp/pylatex-tmp.s6glcywi/2097fd2c-1d61-421e-8380-1358543e84cc.pdf}% \caption{I am a caption.}% \end{figure} % Created using matplotlib. % Conclusion.% \end{document} |
matplotlib_ex-facecolor.pdf